Debugging and Sharing
Beat Link Trigger offers a few mechanisms to help you understand how
your triggers are (or are not) working, and to save and restore
versions of them, or share them with friends and colleagues (or
on the Gitter chat
or project Wiki
to either get help from others, or share and show them off).
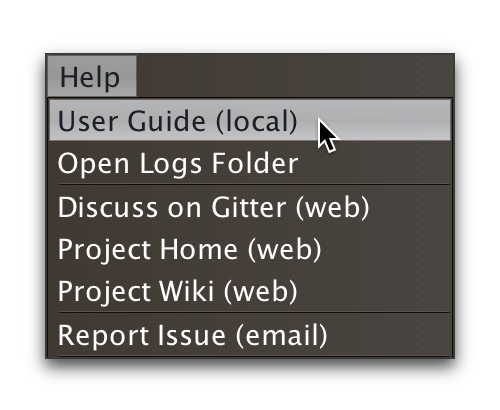
Help resources can be found in the Help menu, along with an embedded copy of this User Guide, which can be used even if you are not connected to the Internet (although links to other sites will not work in that case).
There’s no way for the author to know how many people are using the the program, or where they are, unless they choose to contact him. Many people have (especially on the Gitter chat), but if you have not, and would like to say hello and share how you are using Beat Link Trigger, it would be greatly appreciated! You can use to make it easy.
Logs
When Beat Link Trigger is running it reports events to a log file. As noted above, this includes full stack traces for compilation problems when you try to save an expression that isn’t quite right. If a problem occurs while trying to run your expression later, that will end up in the log too. So it can be a useful place to look when things are not working the way you expect. You can find the log file by choosing .
Each time you launch Beat Link Trigger it creates a new log folder in a temporary directory, so that they can be cleaned up automatically sometime after it exits. It cycles through log files and limits their maximum length, which can be important if an error is being logged each time a packet comes in because of a problematic Enabled Filter expression.
Even if things are not crashing, you might want to log your own information to get a better understanding of what is happening inside one of your expressions. Beat Link Trigger uses timbre to perform its logging, and so can you.
For example, if you are trying to figure out exactly what you are receiving in your Beat expression, you could add this as its first line:
(timbre/info "Received beat" status "master?" tempo-master?)Suddenly your logs will be growing steadily, filling with lines like these:
2016-Jun-05 00:12:10 Alacrity.local INFO [beat-link-trigger.expressions:?] -
  Received beat Beat: Device 2, name: CDJ-2000nexus, pitch: +0.00%,
  track BPM: 126.0, effective BPM: 126.0, beat within bar: 4 master? true
2016-Jun-05 00:12:11 Alacrity.local INFO [beat-link-trigger.expressions:?] -
  Received beat Beat: Device 33, name: DJM-2000nexus, pitch: +0.00%,
  track BPM: 126.0, effective BPM: 126.0, beat within bar: 1 master? false
Reporting Issues
If you run into trouble and it seems likely the problem is in Beat Link Trigger itself rather than one of your own expressions, you can use to send an email to Deep Symmetry asking for help. The message will start out populated with some information about the version of Beat Link Trigger you are running, along with the Java version and operating system, but the more details you can provide in the initial report (along with relevant logs), the more likely we will be able to figure out what is going on.
The program may also offer to compose an issue pre-filled with details when it encounters unexpected messages sent by CDJs it is talking to.
If the problem turns out to be trickier than can be understood from just logs, follow-up questions and experimentation may be needed. In such cases thread dumps are often a valuable next step.
Wireshark Captures
If you are helping investigate an issue involving communication with the DJ Link gear (especially when new products are released), it will be necessary for you to include a packet capture of what was happening on the network when you saw the problem or tried to use the gear. For that, download and install Wireshark, then perform a capture and include the file in your report.
To make it easier to understand how the capture relates to an issue you are seeing, it is even better if you can include a movie of your screen showing when the problem happens, and also include the precise timestamp in that video. The easiest way to have timestamps appear in your video is to download and open the Timestamp show that is embedded in this guide, and position its window near the part of your screen where you are capturing the issue. The Timestamp show looks like this:
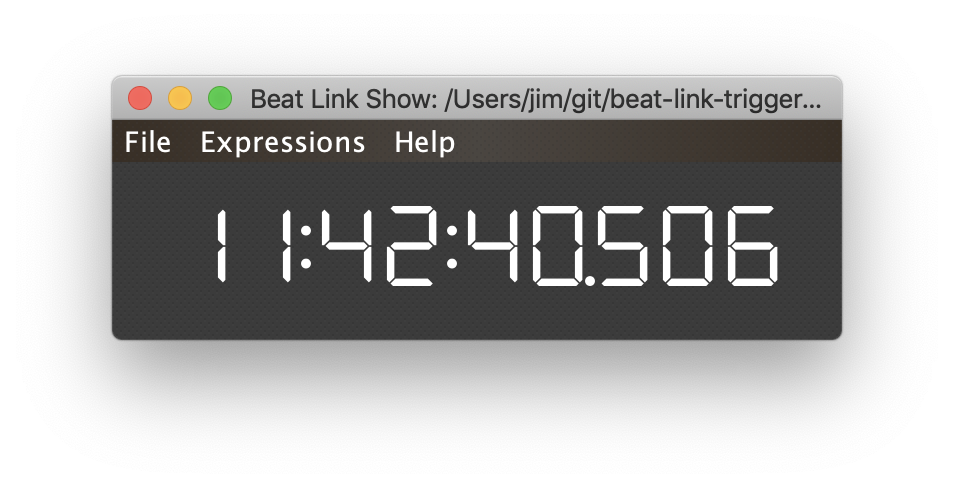
The timestamps it displays are identical to the ones that Wireshark writes in the capture file, which makes it possible to correlate things happening on the screen with packets in the capture.
If there is room to have the Wireshark capture window appear in your video also, great! That can be very helpful, but the timestamp window is easier to read at small movie sizes.
|
In case you are curious, the code that implements this Timestamp show is very short: Global Setup Expression
And when the window closes, we tell the animation thread to stop by
removing the Global Shutdown Expression
Since those are the only things in the show, the file is only 560 bytes long. |
GitHub Issues
You can also skip the email and open an Issue directly on the project’s GitHub page.
In any case, even if Deep Symmetry is unable to investigate your report immediately (since this is free software developed during our spare time), we very much appreciate you taking the effort to send it.
Inspecting Locals and Globals
In addition to logging values to the log file, you can get a glimpse
at what your expressions are up to by opening an inspector window on
the Expression Globals or a particular trigger’s Expression Locals.
The first is done by choosing . This opens a window showing you all the keys and values that
have been created in the globals atom shared by all triggers. Here
is what that looks like after the example code shown in the
Global Expressions section has run:
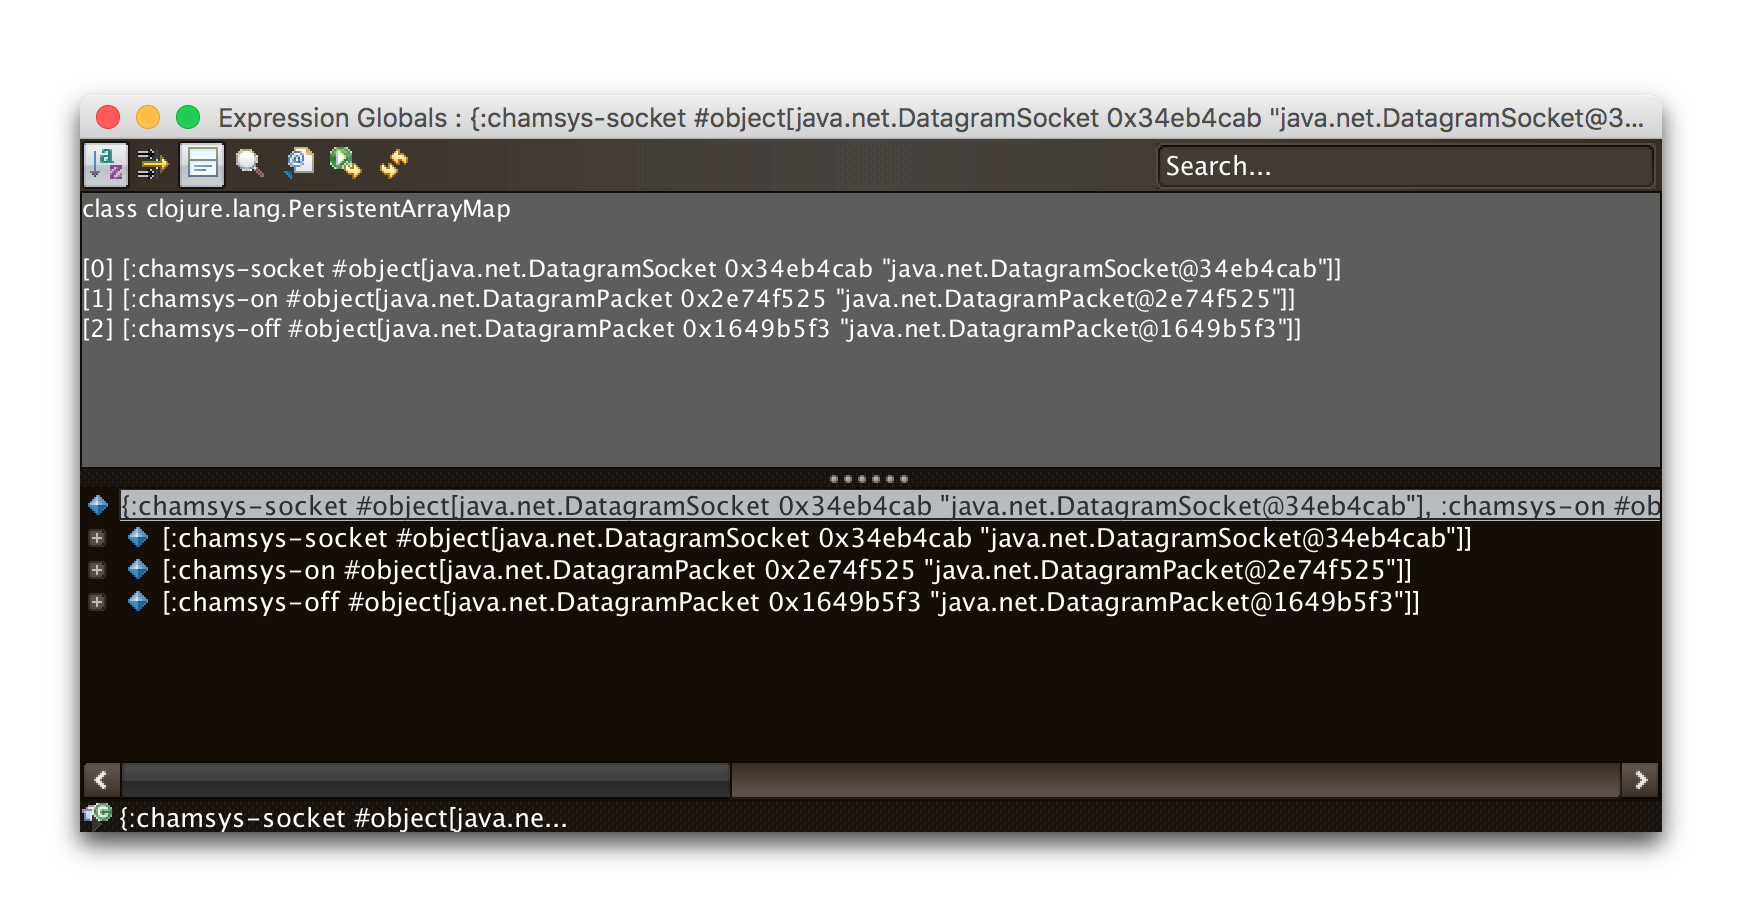
The inspector is a little messy, but right away you can see the three keys we created, and the corresponding Java objects stored under them. by clicking next to the blue diamond in the lower pane, you can expand each entry and dive down into the fields and values that make it up, which can be quite a powerful way to explore the objects.
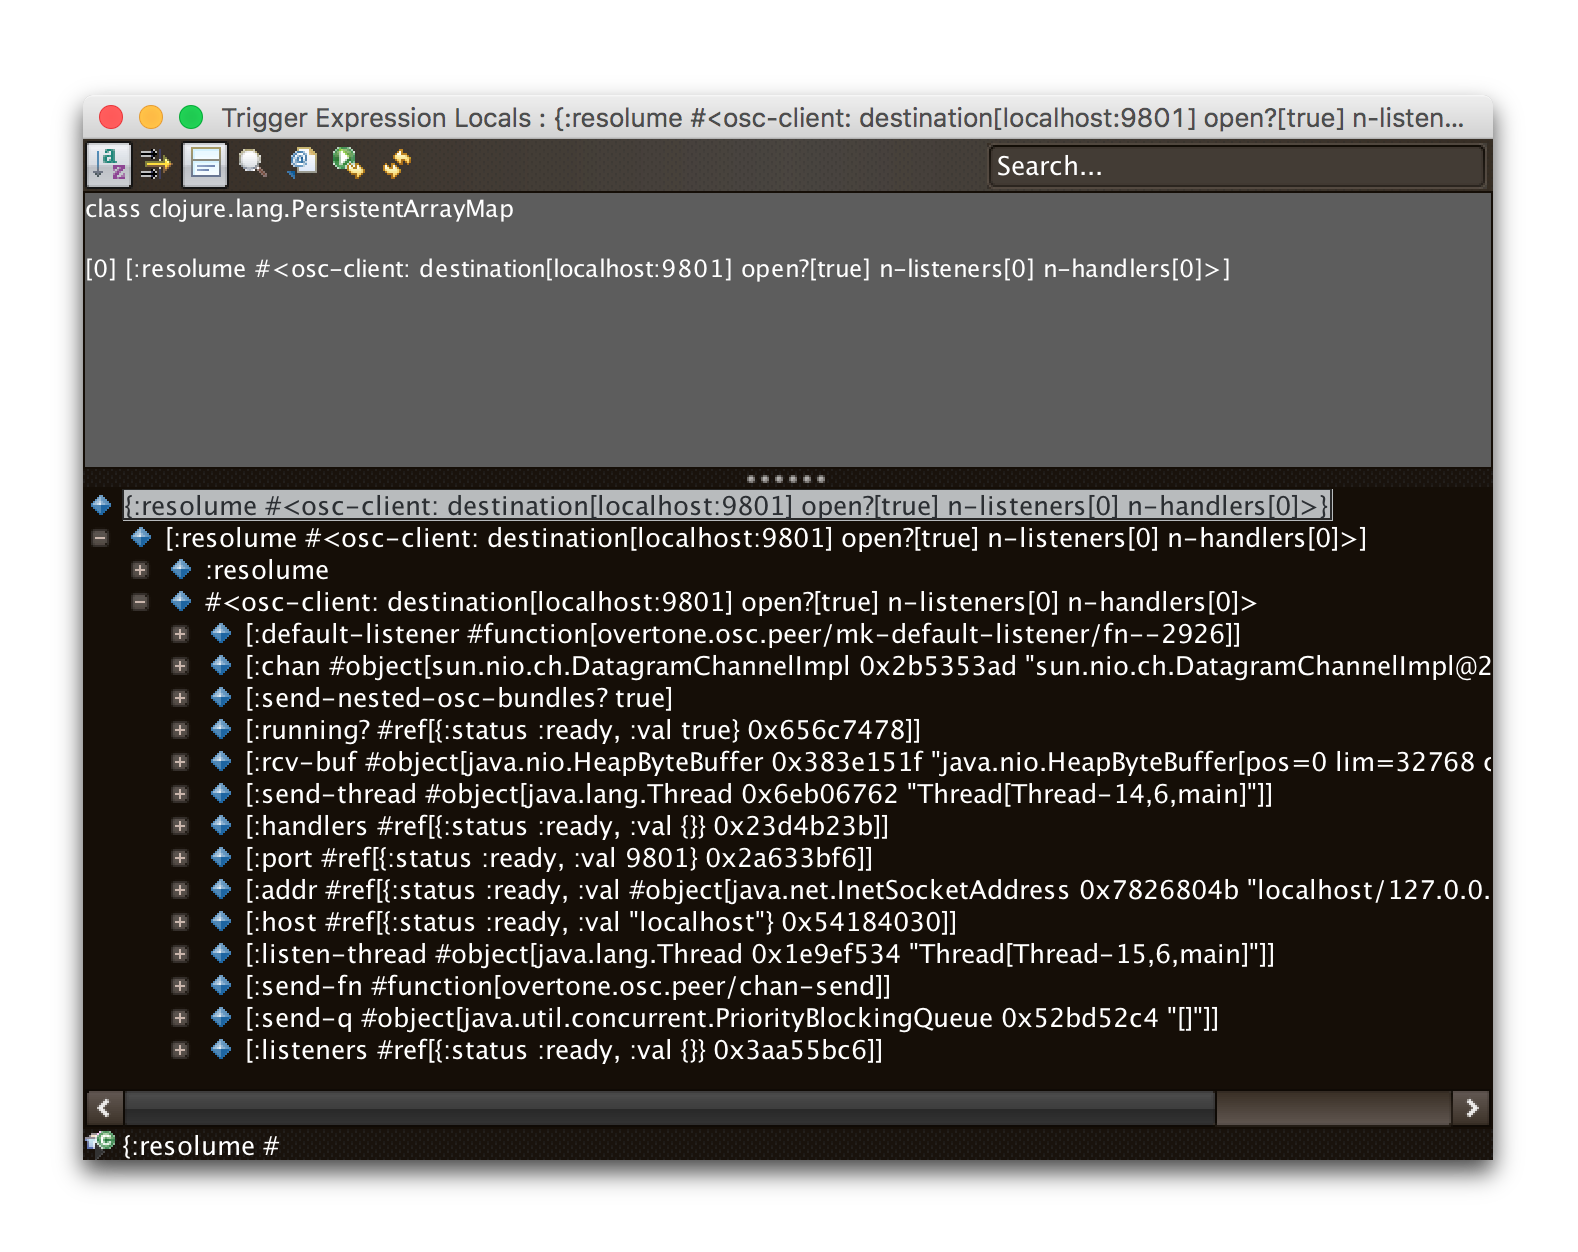
Similarly, the locals for a trigger can be inspected by choosing
Inspect Expression Locals from that trigger’s context menu.
Here’s the result of drilling down a little into the :resolume OSC
client object created in that example’s trigger:
Saving and Loading
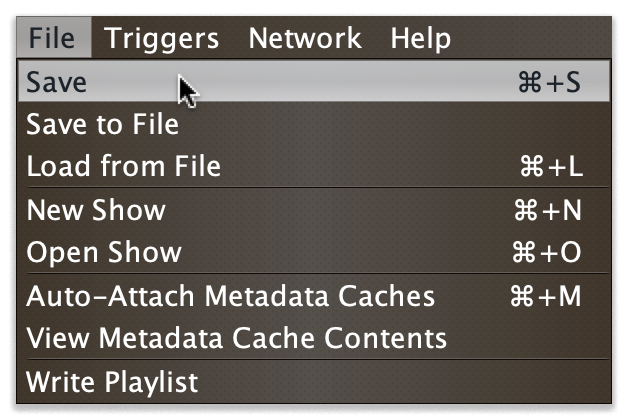
The entire trigger configuration can be saved to a text file by choosing . That file can be sent to another machine, shared with a colleague, or just kept around for future use after you are done with a different project. As you would expect, replaces the current trigger configuration with one loaded from a save file.
|
Beat Link Trigger automatically saves your triggers when you exit the program normally. If you shut down your computer, or otherwise force-quit the Beat Link Trigger process, it may not have the chance to do this, and you might lose work. If you are concerned about that happening, you can periodically manually save your current trigger configuration by choosing .
|
Exporting and Importing Triggers
As mentioned in the Triggers Context Menu section, individual triggers can be exported on their own, and imported into other trigger configurations.
Writing Playlists
If you are in a situation where it is important to keep detailed records of the music being played (for example, a radio station that needs to pay royalties), the built in Playlist Writer can help. It builds on the ideas described in the Matching Tracks section to give you a robust, convenient solution.
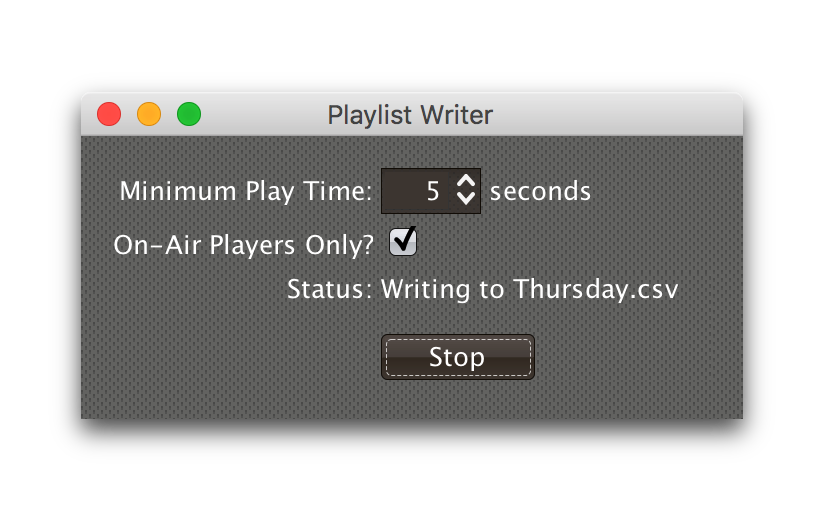
Start by choosing . This will bring up the Playlist Writer window.

You can configure how long a track needs to be played for before it gets included in the playlist and whether you want to ignore players that are not reporting themselves as being on the air (very convenient to ignore DJs pre-screening tracks, as long as you are using a DJM mixer that supports this feature, and the players are configured and connected properly).
Once everything is set the way you want it, click Start and you will be prompted to choose where to save the file. Once you have done that, the window updates to show you that the playlist is being written:
From this point on, all tracks that play longer than your configured minimum time will be written to the playlist, in Comma-Separated Value format (for convenient use in spreadsheet programs). The playlist will include track titles, artists, albums (when this information is available), as well as the player they were played on, the source player and media type, when they started and stopped playing, and the total time they played.
When you are done recording the playlist you can either click Stop or close the window, and the file will be closed out.
Advanced Coding
The built in code editor gives you some basic help with writing Clojure, such as syntax coloring and parenthesis matching, but if you are going to write more than a few lines, or want help learning Clojure and testing ideas, you are much better off using a full-featured Clojure development environment, like Cursive or (if you already use the Emacs text editor) CIDER.
Much of the power of these environments comes from the way they interact with the live, running Clojure environment so that you can benefit from code-completion assistance, documentation popups, and even dive into the source code of your functions and the ones that make up Beat Link Trigger itself, making it easy to try things out, update your functions, examine values, and try again. This kind of instant feedback leads to a fertile learning experience and incredibly productive development workflow centered around the Clojure “REPL” (read-eval-print loop).
Beat Link Trigger has features to support working in these editors. At a basic level, the built-in code editor can save your expression or function code to an external text file, which you can edit in one of these environments, and then have the built-in editor load the results back in. But you will get the best results if you turn on a network REPL server inside BLT so the external IDE can connect to it and operate at full power.
To do this, choose :
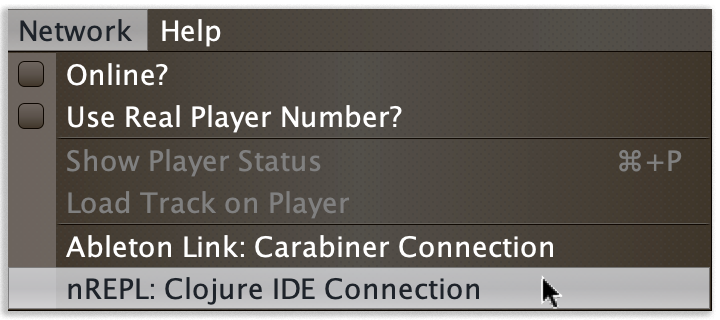
This will open a small window which allows you to configure and start the nREPL server the IDEs can use:
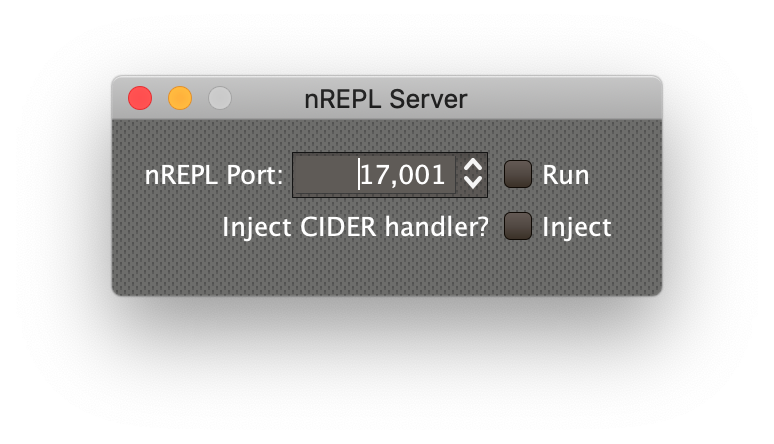
The default port number was chosen to be different from the Carabiner port (in case you are using that), and unlikely to be otherwise used. If for some reason port 17,001 is in use on your computer, you can pick a different port. You just need to tell the IDE which port you are using when you have it connect to the nREPL server.
If you are going to use Cursive, you can simply start the server by
clicking the Run checkbox. If you are going to use CIDER, to make
full use of CIDER’s powerful features, click the Inject checkbox
first, which will configure the nREPL server to add special CIDER
middleware. (If you forgot to do this, you can uncheck the Run
checkbox to stop the server, check Inject, and then Run it again.)
Although it probably won’t hurt to inject the CIDER handler when using a different editor, it’s a little safer to leave it out of the loop if you don’t need it.
Connecting from Cursive
Once you have the nREPL server running (without injecting the CIDER
handler), you will want to follow the Cursive instructions for
Remote
REPLs, using the Connect to server radio button, entering
127.0.0.1 as the Host (assuming you are running Cursive on the
same machine as Beat Link Trigger, although you don’t have to!) and
then set the Port value to the one you chose in Beat Link Trigger.
Once you have your Remote REPL configuration created, it appears in the menu at the top right of the project window, and you can connect to it by pressing the green triangle (play button) to the right of it (I named my configuration BLT nREPL):
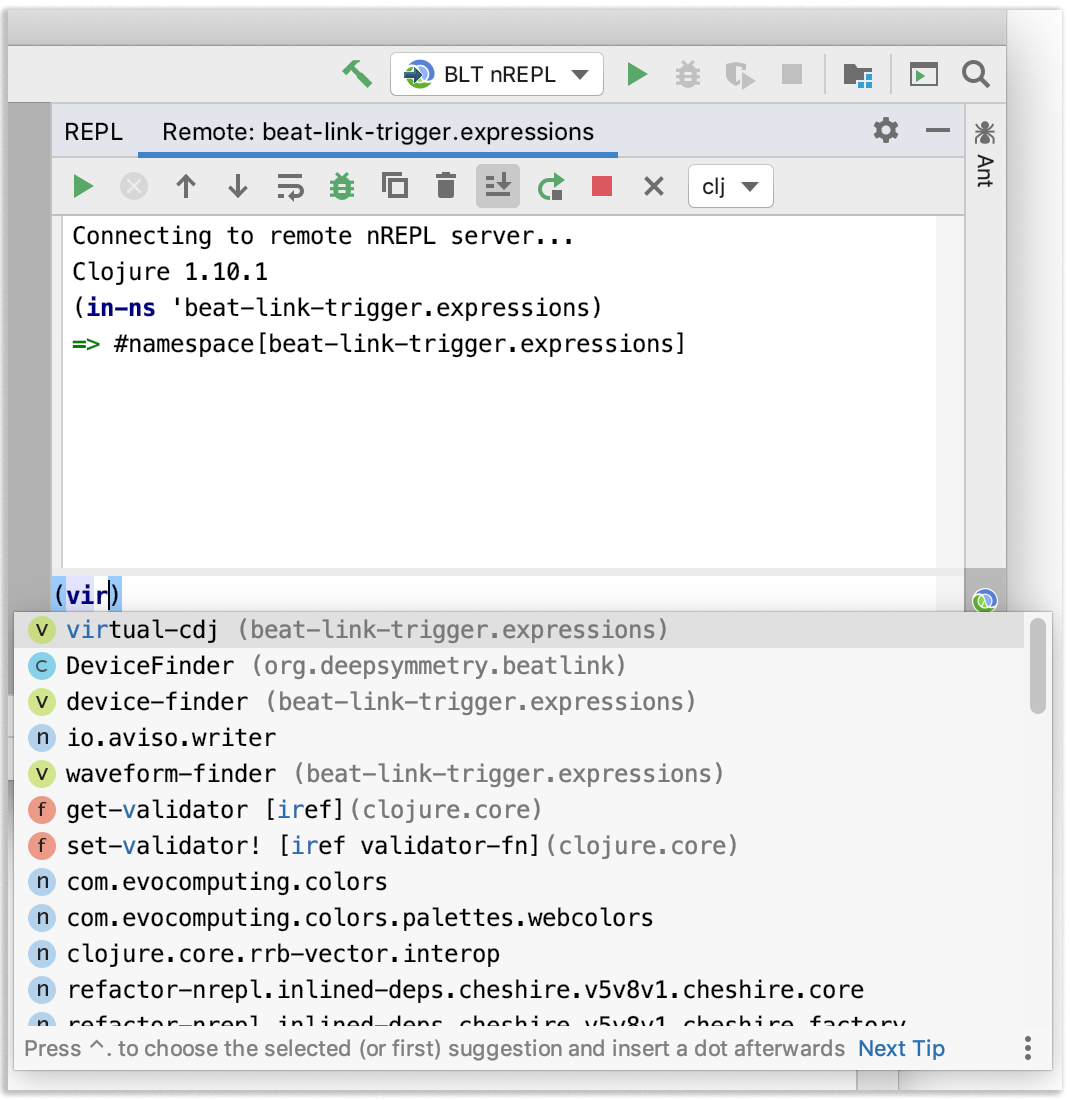
Whatever expressions you type at the bottom of the REPL window are immediately evaluated, and the results shown above, and you can use Cursive’s editor window features to send functions and files to the REPL. Cursive’s built-in completion can be seen in action at the bottom of the above screen shot. See the Cursive User Guide for more information.
Connecting from CIDER
Once you have the nREPL server running with the CIDER handler
injected, you can tell CIDER to connect to it by typing M-x
cider-connect RET and CIDER will prompt you for the host and
port information. If you are running BLT on the same machine as CIDER,
enter localhost or 127.0.0.1 for the host, and then enter the port
number you chose in Beat Link Trigger.
The CIDER Docs give you the details of how to work with it.
Using the Connection
Regardless of the IDE you are using, you will probably want to switch
your namespace to beat-link-trigger.expressions because this is
where your Shared Functions live, and they are where you should put
your most sophisticated coding, so that individual expressions can be
short and sweet, using the Shared Functions for the heavy lifting.
This namespace is also configured to include Clojure’s
developer-friendly functions like doc (to let you look at the
documentation for a function or variable), source (to let you see
the source code of a function), and so on. The
Clojure documentation
mentions some of the things you can do at the REPL (although you can
ignore the parts that talk about how to start Clojure; Beat Link
Trigger has already done that for you). There is a page about
basic usage,
navigating
namespaces, and a
collection
of resources describing REPLs and the mindset of using them
effectively. (The navigation links on the left side and top of those
pages can take you other good places for learning about the REPL,
Clojure, troubleshooting, and so on.)
For more ideas specifically about how to explore Beat Link Trigger from a Clojure IDE, mention you are doing it on the Gitter Chat!